QC
See the qc hydra-genetics module documentation for more details on the softwares for the quality control. Default hydra-genetics settings/resources are used if no configuration is specified.
Pipeline output files:
results/dna/qc/multiqc_DNA.htmlresults/dna/{sample}_{type}/qc/{sample}_{type}.coverage_and_mutations.tsvgvcf_dna/{sample}_{type}.mosdepth.g.vcf.gz
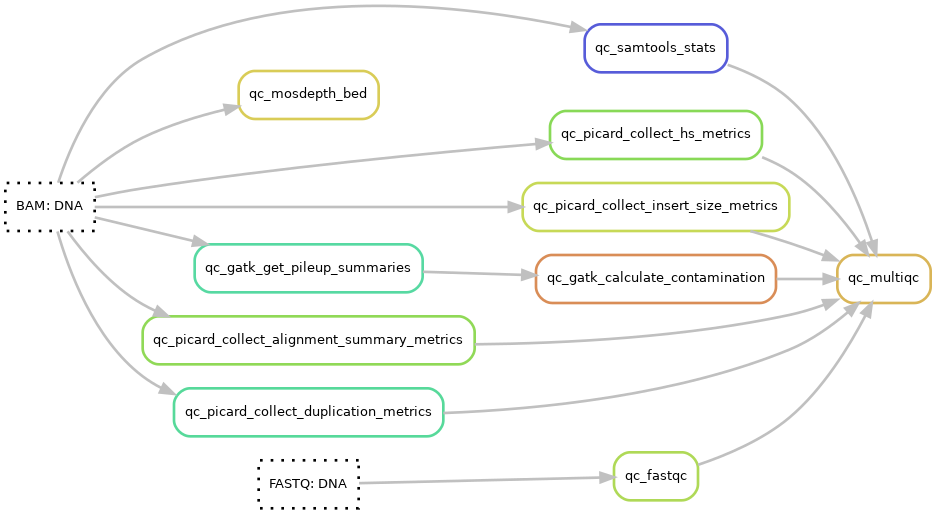
MultiQC
A MultiQC html report is generated using MultiQC v1.11. The report starts with a general statistics table showing the most important QC-values followed by additional QC data and diagrams. The qc data is generated using FastQC, samtools, picard, and GATK.
Configuration
Software settings
multiqc: reports: DNA: config: Config of the general statistics tableqc_files: Configuration of input files to MultiQC in the config file:
# config.yaml
multiqc:
  container: "docker://hydragenetics/multiqc:1.11"
  reports:
    DNA:
      config: "config/multiqc_config_dna.yaml"
      included_unit_types: ["N", "T"]
      qc_files:
        - "qc/fastqc/{sample}_{type}_{flowcell}_{lane}_{barcode}_fastq1_fastqc.zip"
        - "qc/fastqc/{sample}_{type}_{flowcell}_{lane}_{barcode}_fastq2_fastqc.zip"
        - "qc/picard_collect_alignment_summary_metrics/{sample}_{type}.alignment_summary_metrics.txt"
        - "qc/picard_collect_duplication_metrics/{sample}_{type}.duplication_metrics.txt"
        - "qc/picard_collect_hs_metrics/{sample}_{type}.HsMetrics.txt"
        - "qc/picard_collect_insert_size_metrics/{sample}_{type}.insert_size_metrics.txt"
        - "qc/samtools_stats/{sample}_{type}.samtools-stats.txt"
        - "qc/gatk_calculate_contamination/{sample}_{type}.contamination.table"
FastQC
FastQC v0.11.9 is run on the raw fastq-files.
Configuration
Cluster resources
| Options | Value |
|---|---|
| mem_mb | 12288 |
| mem_per_cpu | 6144 |
| threads | 2 |
Samtools
Samtools stats v1.15 is run on BWA-mem aligned and merged bam files.
Picard
Picard v2.25.0 is run on BWA-mem aligned and merged bam files collecting a number of metrics. The metrics calculated are listed below:
- picard CollectAlignmentSummaryMetrics - using a fasta reference genome file
- picard CollectDuplicationMetrics
- picard CollectHsMetrics - using a fasta fasta reference genome file, a design bed file, and with the option COVERAGE_CAP=5000
- picard CollectInsertSizeMetrics
GATK
Cross-sample contamination is estimated using GATK v4.1.9.0. The contamination is calculated by gatk GetPileupSummaries making pileups for input SNP positions on BWA-mem aligned and merged bam files followed by evaluating these pileups with gatk CalculateContamination. Contamination levels should very low so that already at 1% there is reason to be concerned.
Genome vcf
Using GATK Mutect2 v4.1.9.0 it is possible to make a vcf with alternative allele information for all positions in the design bed. As in the ordinary variant calling the individual chromosome bamfiles are used and then the vcf-files are merged. Additionally, the coverage of all positions are calculated using mosdepth v0.3.2 and then added to the final vcf file.
Configuration
References
- fasta reference genome
- design bed region file (split by bed_split rule into chromosome chunks)
Cluster resources for Mutect2
| Options | Value |
|---|---|
| mem_mb | 12288 |
| mem_per_cpu | 6144 |
| time | "48:00:00" |
Result file
gvcf_dna/{sample}_{type}.mosdepth.g.vcf.gz
Coverage and mutations
This excel-friendly report produced by the in-house script hotspot_report.py (rule and configuration) contains coverage in all clinical relevant positions defined in a "hotspot"-file and flags positions with low coverage. It also collects information on the filtered variants from the vcf file. The coverage flag is configured by the levels option, included columns are configured in hotspot_report.yaml and chromosome id translation is done by hotspot_report.chr.translation.hg19.
Configuration
References
- File with clinical relevant positions
Software settings
report_config: "config/hotspot_report.yaml"
chr_translation_file: "config/hotspot_report.chr.translation.hg19"
levels:
  - [200, "ok", "yes"]
  - [30, "low", "yes"]
  - [0, "low", "not analyzable"]
Result file
results/dna/{sample}_{type}/qc/{sample}_{type}.coverage_and_mutations.tsv
Sample mixup check
The sample mixup check compares the ID-SNPs in the DNA sample to the RNA sample in the same analysis and reports sample similarities to be able to discern sample mixups. The check is performed by the in-house script sample_mixup_check.py (rule and config).
Result file
results/sample_mixup_check.tsv
Somalier relatedness check
The somalier relatedness check uses Somalier to estimate relatedness between all samples (DNA and RNA) in the analysis. This is used to verify that samples from the same individual cluster together. The results are summarized in a best match report produced by the in-house script somalier_best_match.py (rule and config).
Result file
results/qc/somalier/somalier_best_match.tsv
Somalier DNA-DNA relatedness check
A specific check for DNA-DNA sample pairs using Somalier relatedness data. It helps identify potential mixups between DNA samples from the same analysis. The report is generated by the somalier_dna_dna_match.py script (rule and config).
Result file
results/qc/somalier_dna_dna_match.tsv